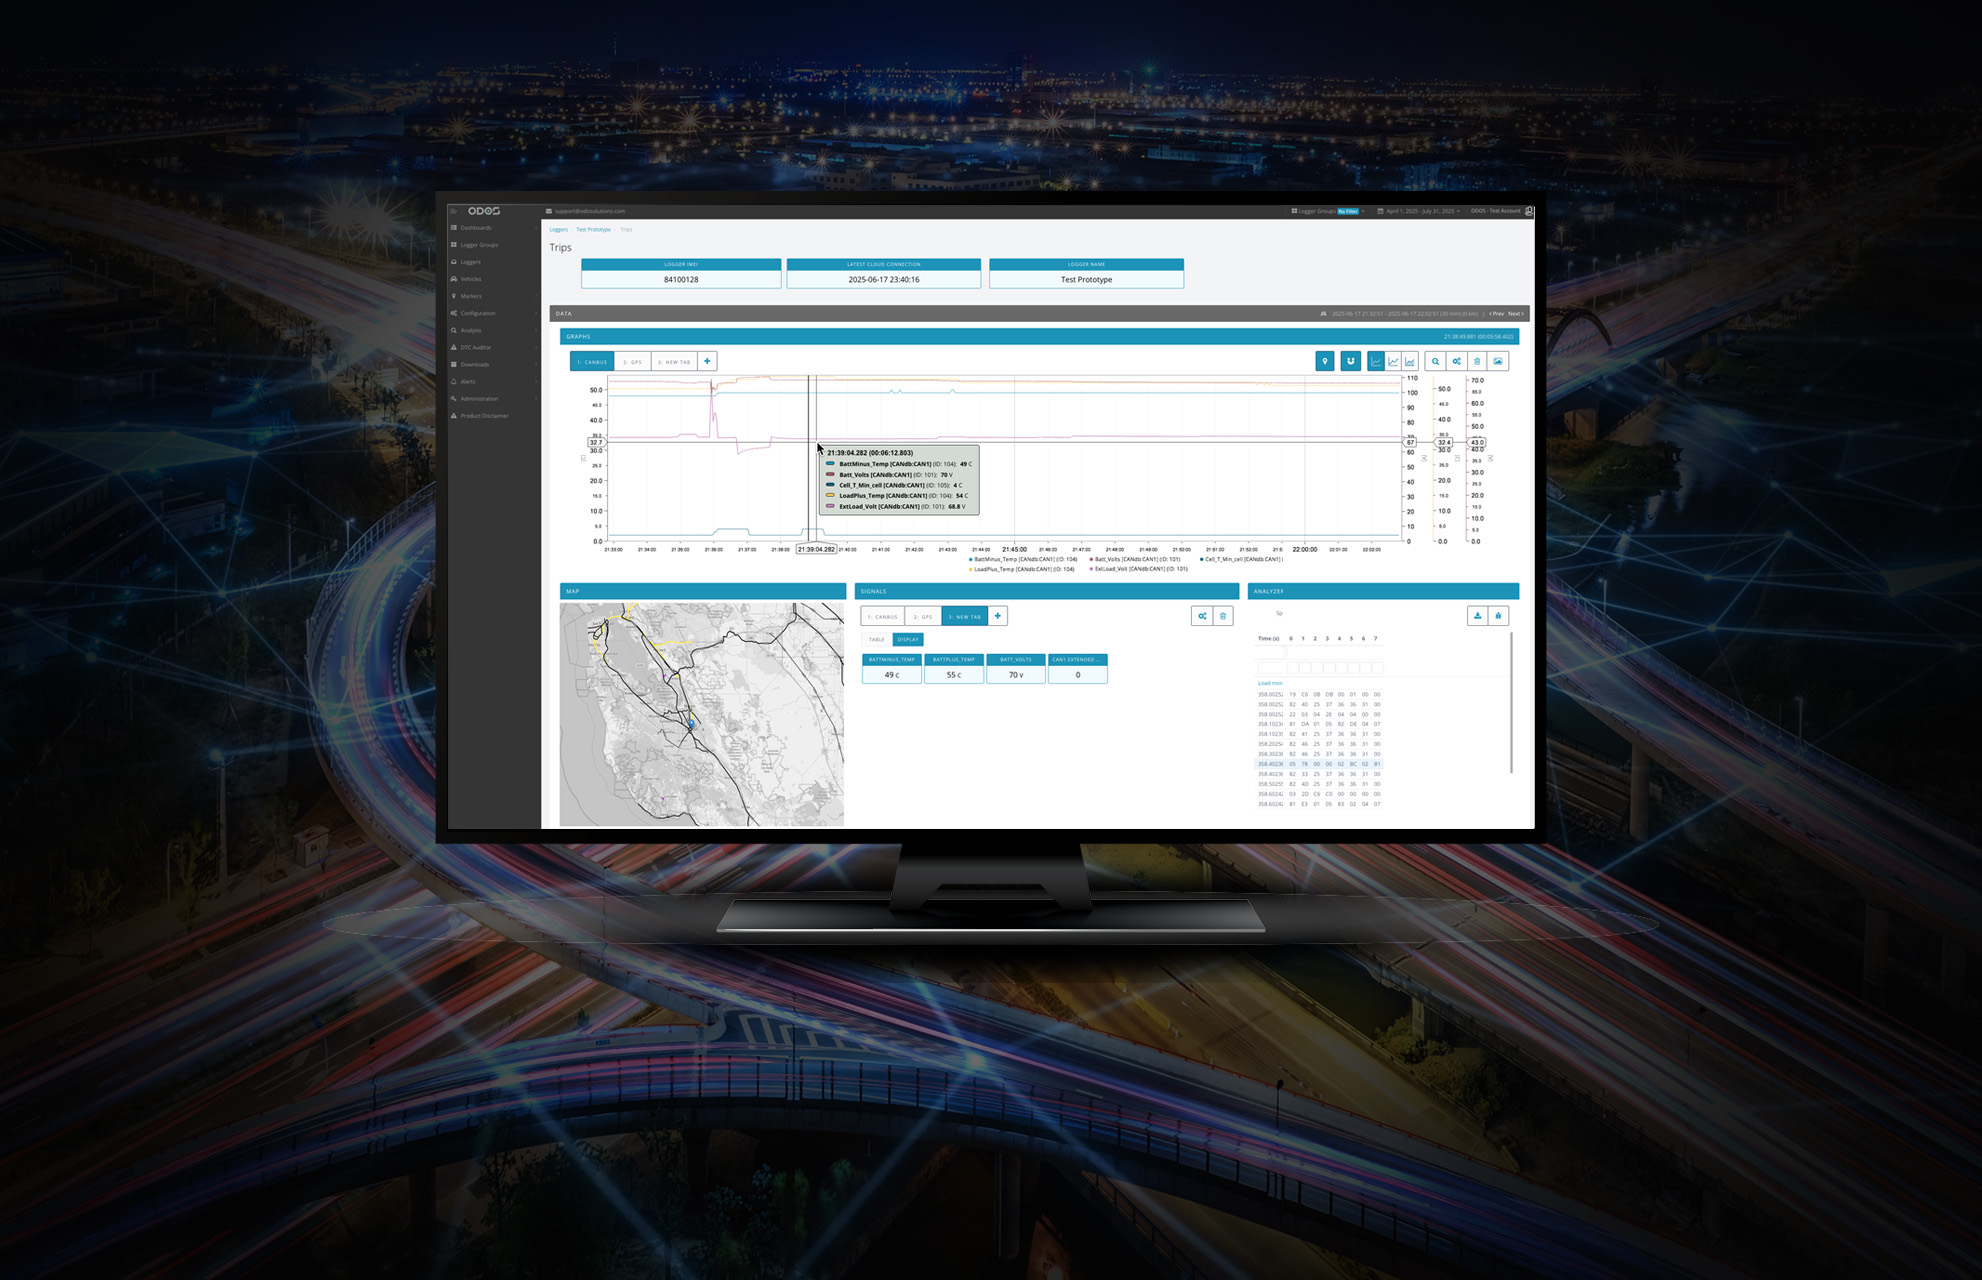
Our fully customizable dashboard, the ODOS CloudSoft, visualizes and organizes all the data your loggers collect. It is the core of the ODOS ecosystem for cloud-based data logging.


Cloud-based data logging is the process of collecting, storing, and managing measurement data – or DAQ – directly in the cloud instead of on local devices. This ensures your information is secure, synchronized, and available wherever you are.
What makes ODOS unique is its ability to deliver true real-time data acquisition through the cloud. Data isn’t just uploaded periodically – it’s instantly available, enabling immediate insight and faster decision-making.
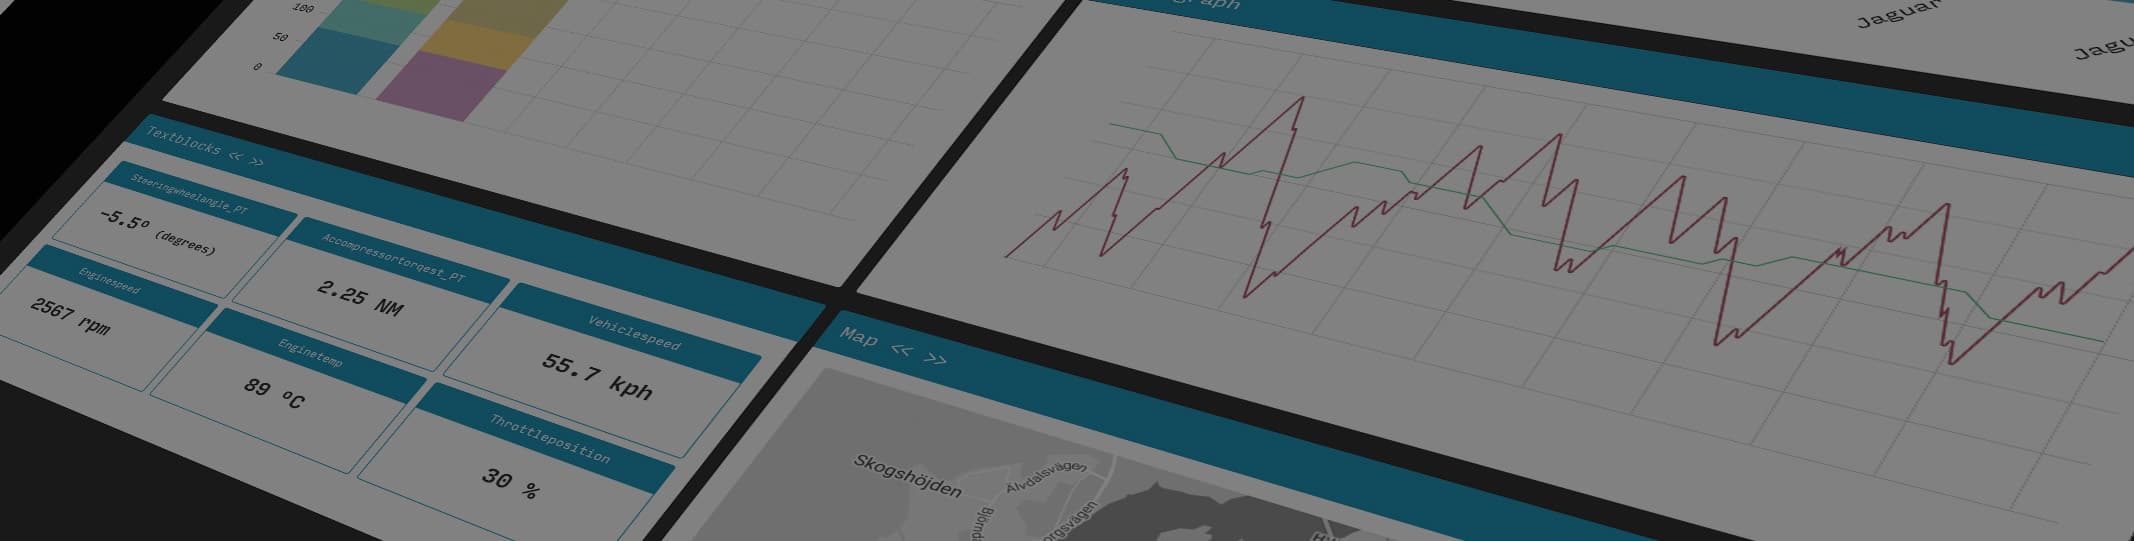
DASHBOARD FEATURES
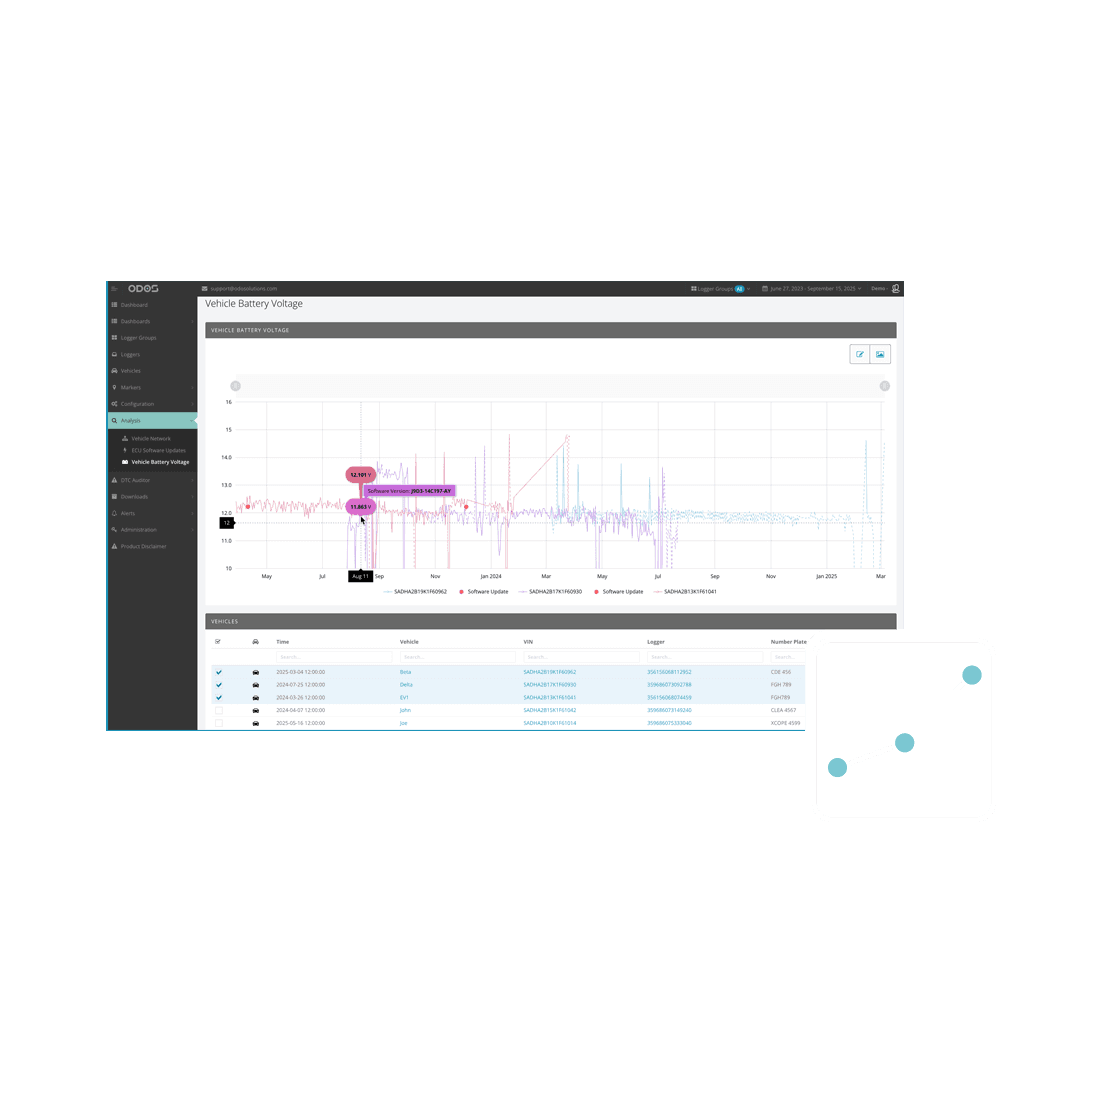
Line charts make it easy to track how values change over time — for example, spotting peaks in power consumption or observing gradual temperature increases. They are a powerful way to visualize trends, patterns, and fluctuations across a wide range of data types.
DASHBOARD FEATURES
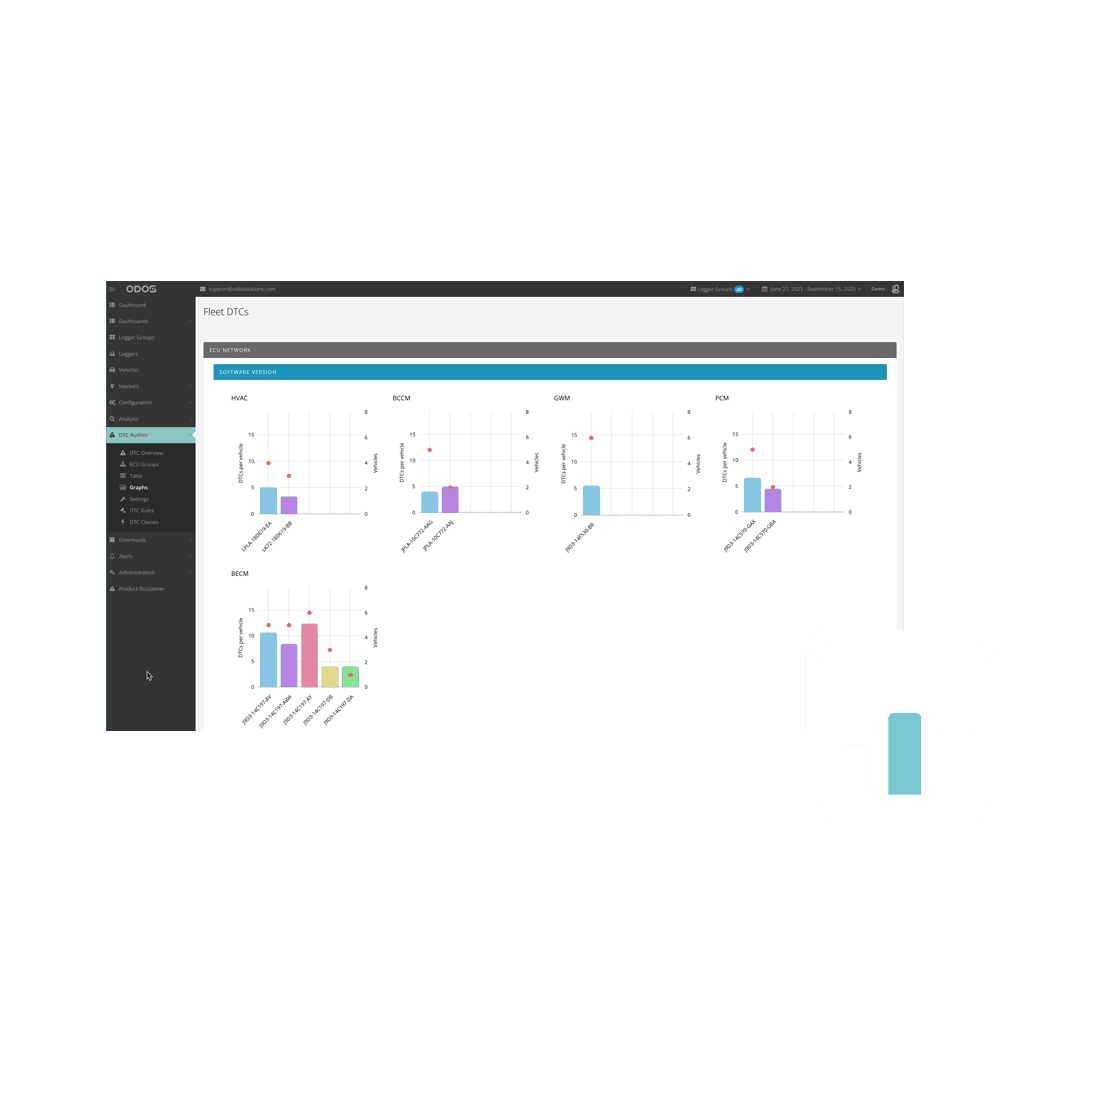
Bar charts in ODOS let you compare different aspects of your fleet side by side — for example, fuel consumption per vehicle, mileage per driver, or maintenance costs across vehicle types. They make it easy to spot differences and identify top or underperforming units.
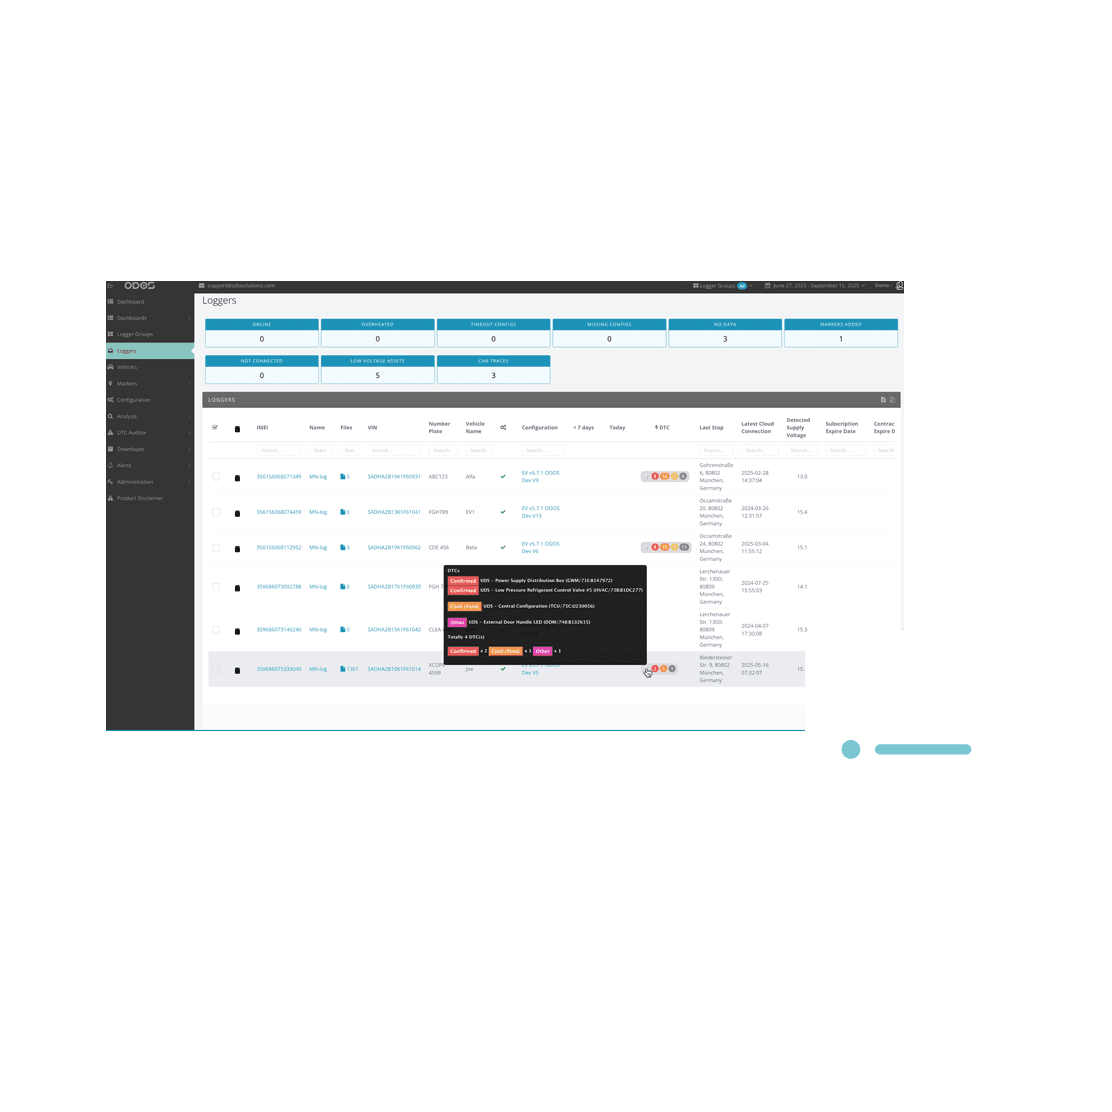
DASHBOARD FEATURES
Lists in ODOS are perfect for presenting detailed information in a structured way — such as diagnostic trouble codes (DTC), service history, or recent alerts. They make it easy to scan, filter, and act on specific events or data points across the fleet.
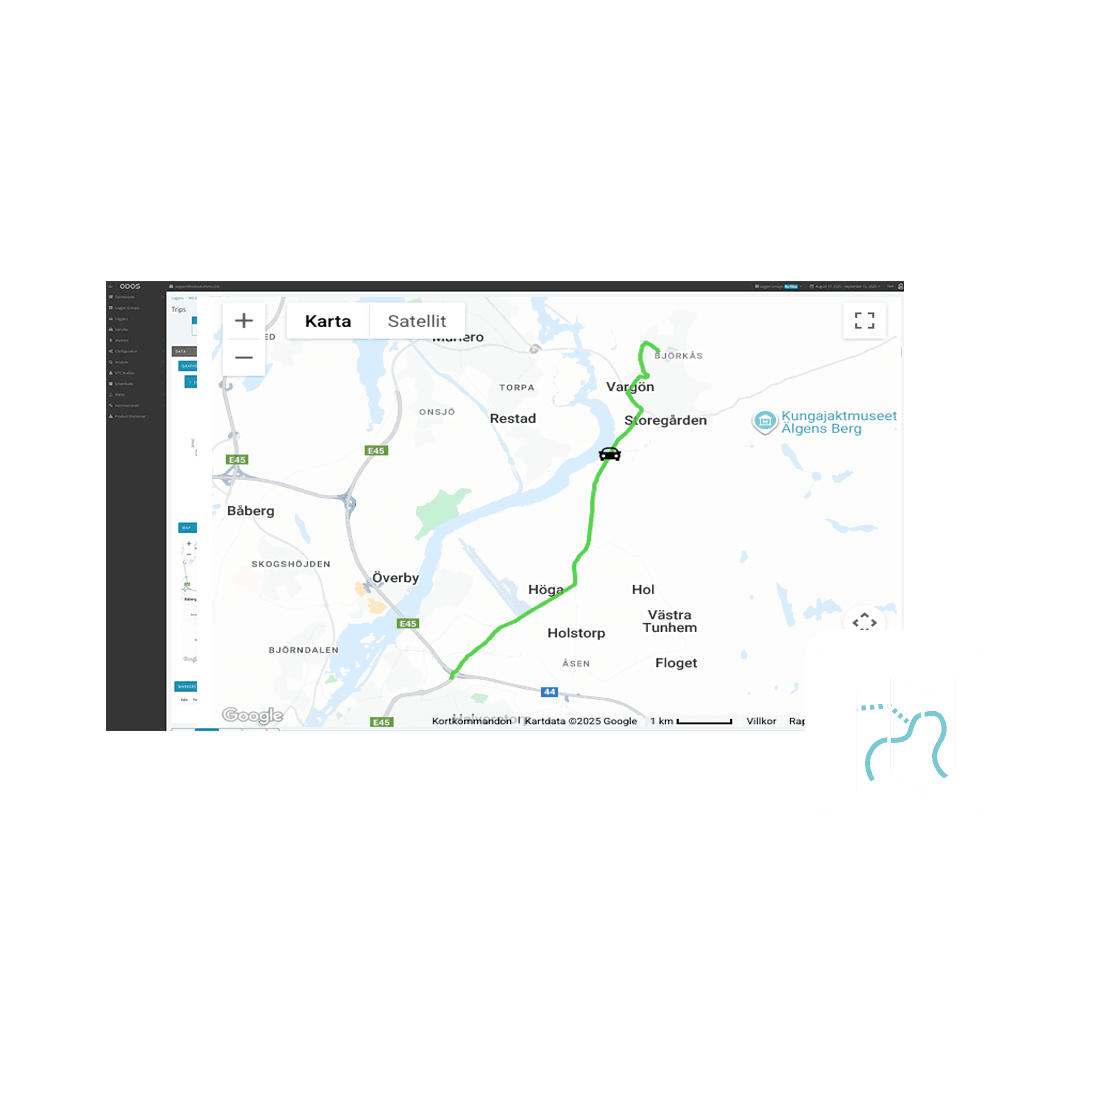
DASHBOARD FEATURES
Maps in ODOS give you a real-time view of your fleet’s position and movement. Whether it’s tracking individual vehicles, following routes, or analyzing trip patterns, maps turn GPS data into an intuitive overview of where and how your vehicles operate.
We’d love to show you what ODOS CloudSoft can do. Share your email with us, and we’ll get in touch to schedule a demo at a time that suits you.
Starting from CAN snapshot to full bus streaming.


